What is the relationship between star luminosity and temperature?
The light pouring from a distant star is the result of a fundamental physical relationship governed by two primary characteristics: how hot its surface is and how large that surface area happens to be. Understanding this connection between a star’s luminosity—its total intrinsic energy output—and its temperature opens the door to mapping the entire stellar life cycle. It is one of the most crucial concepts in astrophysics, allowing astronomers to classify stars and estimate their age, mass, and destiny simply by observing their color and measuring their brightness from Earth. [4][9][10]
# Light Power
Luminosity describes the total amount of energy a star radiates into space every second, typically expressed in watts or, more conveniently for astronomers, relative to the output of our own Sun (). [7][2] It is an intrinsic property, meaning it does not change based on the observer’s distance. This is different from apparent brightness, which is how bright the star appears from our vantage point on Earth and does decrease significantly as distance increases. [7] When we talk about a star’s inherent power—its luminosity—we are talking about its absolute energy production capability. [2]
# Surface Heat
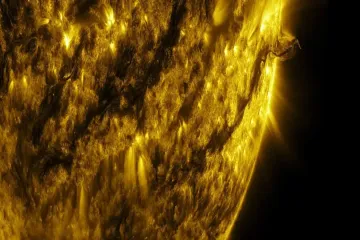
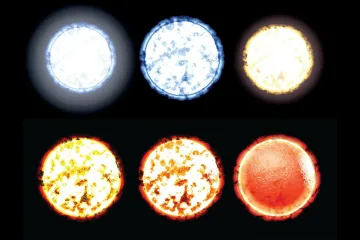
A star's temperature is usually defined as its effective surface temperature, which dictates the star's color. [4] Hotter stars emit the vast majority of their light at shorter wavelengths, appearing blue or white. [4][9] Conversely, cooler stars radiate most strongly at longer wavelengths, giving them a distinct reddish hue. [9] The range of surface temperatures for stars is vast, spanning from a relatively cool $2,000$ Kelvin (K) up to potentially $50,000$ K or even higher for the most massive, hottest examples. [1] This surface temperature is directly observable through spectroscopy or by analyzing the star's peak color. [4]
# Physical Law
The direct link between these two properties—luminosity and temperature—is precisely quantified by the Stefan-Boltzmann Law. [1][5] This law, derived from fundamental physics, states that the total energy radiated per unit area of a black body (which stars approximate) is proportional to the fourth power of its absolute temperature (). [5]
The full equation connects luminosity (), the star's radius (), the Stefan-Boltzmann constant (), and the temperature (): . [1][5]
What this relationship immediately reveals is that luminosity depends on both temperature and size. [5] If you have two stars with the exact same surface temperature, the larger star will always be more luminous because it has a greater surface area radiating energy. [1] This dependence on the fourth power of temperature is incredibly steep. Consider two stars of identical size: if one star has a surface temperature twice as high as the other, its luminosity will be $2^4$, or sixteen times greater, simply due to the temperature difference. [5] This severe temperature dependence is why a small, scorching-hot star can still outshine a very large, cool star if the temperature gap is wide enough.
# Main Sequence
When astronomers plot the properties of thousands of stars, a clear pattern emerges on the Hertzsprung-Russell (H-R) diagram, which plots luminosity against temperature (or spectral class). [4][10] Most stars, including our Sun, fall along a distinct diagonal band called the Main Sequence. [1][9][10]
Stars on the Main Sequence are in the prime of their lives, fusing hydrogen into helium in their cores. [1][9] For these hydrogen-burning stars, the relationship between temperature and luminosity is very direct and tight: as surface temperature increases along the sequence (moving from right to left on the typical H-R diagram), the luminosity also increases significantly. [5][10] This happens because higher core temperatures in Main Sequence stars lead to higher mass and a faster fusion rate, which in turn correlates with a hotter, brighter surface. [1] A star on the left side of the Main Sequence (hot, blue) is inherently more massive and luminous than a star on the lower right (cool, red). [9]
To put this into context, if we observe two stars that are both firmly on the Main Sequence:
- A star with a surface temperature of $10,000$ K is significantly more luminous than one at $5,000$ K. [4]
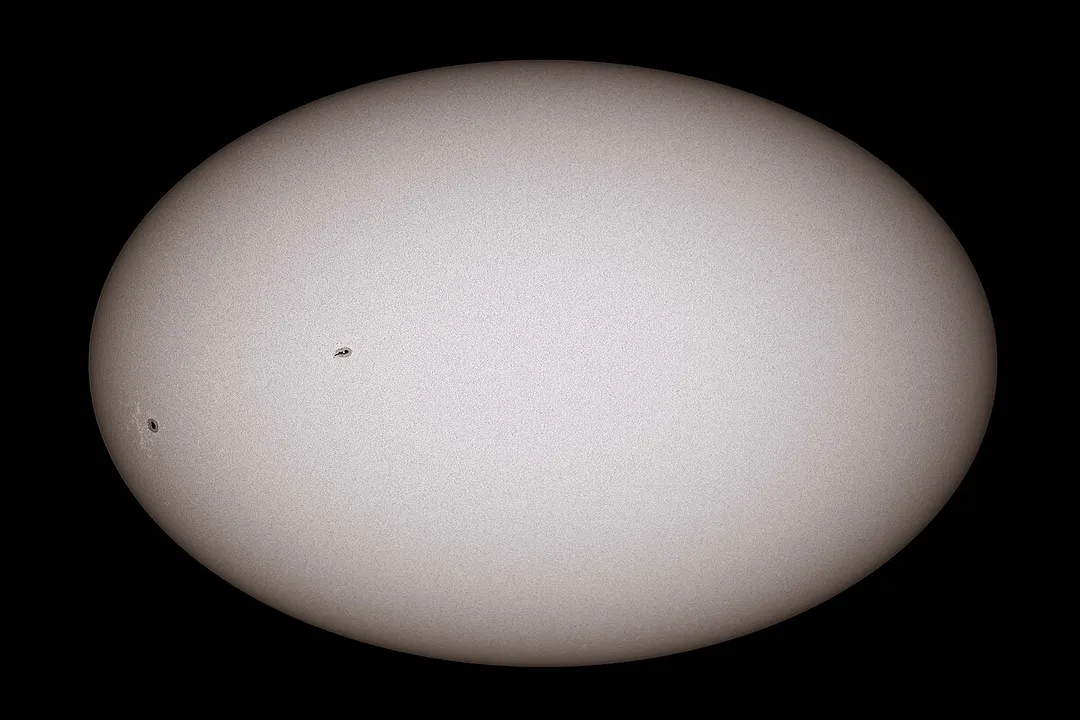
- Our Sun, with a surface temperature of about $5,800$ K, sits squarely on this sequence, representing the baseline for comparison. [2]
# Radius Variance
The neat trend seen on the Main Sequence breaks down when we consider stars that have exhausted their core hydrogen fuel and evolved off that diagonal line. [10] This is where the radius term () in the Stefan-Boltzmann Law becomes the dominant factor, creating distinct groups of stars that challenge the simple "hot equals bright" assumption. [5]
# Giants
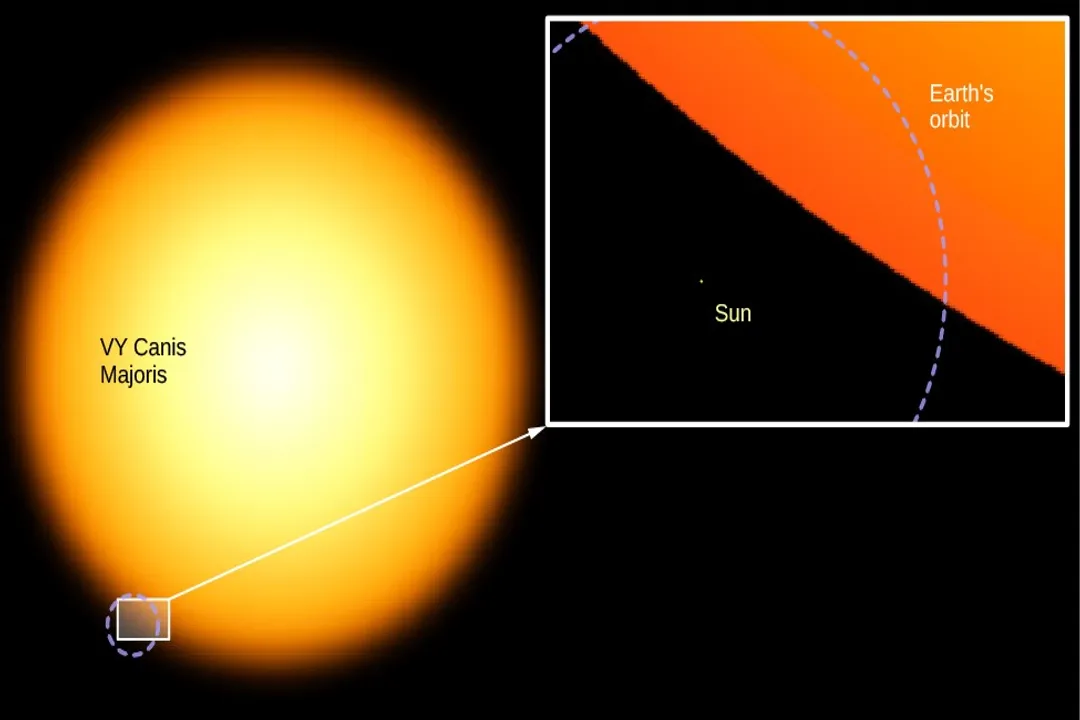
Giants and supergiants are characterized by enormous physical size, even if their surface temperatures are relatively modest—often similar to or cooler than the Sun. [1][10] Because their surface area is so vast, their total energy output is enormous. For instance, a Red Giant might only have a surface temperature around $3,500$ K, but due to its huge radius, its luminosity can be thousands of times that of the Sun. [1][10] On the H-R diagram, these stars occupy the upper right region, far above the Main Sequence. [10]
# Dwarfs
Conversely, White Dwarfs are the remnants of smaller stars, possessing extremely hot surfaces but minuscule radii, often only about the size of Earth. [1] They may have surface temperatures exceeding $50,000$ K, yet because their radiating area is so small, their overall luminosity is quite low, placing them in the lower-left corner of the H-R diagram, far below the Main Sequence. [10] A high temperature combined with a small radius results in low total power. [1]
To illustrate the power of radius in counteracting temperature differences, consider this comparison based on the relationship :
| Star Type | Relative Temperature () | Relative Radius () | Dominant Factor | Resulting Luminosity () |
|---|---|---|---|---|
| Sun (Main Sequence) | 1.0 | 1.0 | Balance | $1.0$ |
| Red Giant | 0.6 (Cooler) | 100 (Much Larger) | Radius | Very High (e.g., ) |
| White Dwarf | 8.0 (Hotter) | 0.01 (Tiny) | Small Area | Very Low (e.g., ) |
| [1][10] |
This shows how a Red Giant, despite being much cooler than the Sun, can be dramatically more luminous purely because its radius is over a hundred times greater. [10] Conversely, a White Dwarf, which is significantly hotter than the Sun, ends up dimmer because its radius is only a fraction of the Sun's. [1]
# Stellar Classification
The direct link between surface temperature and light emission informs the system used to classify stars based on their spectra. [9] This classification system, known by the mnemonic 'Oh Be A Fine Girl/Guy, Kiss Me' (O, B, A, F, G, K, M), arranges stars in decreasing order of surface temperature, from the hottest O-type stars to the coolest M-type stars. [4][9]
The spectral classes correspond tightly to color and temperature:
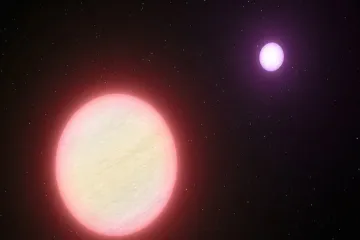
- O and B stars are extremely hot, blue to blue-white, and very luminous. [4]
- A and F stars are white. [4]
- G stars (like our Sun) are yellow-white, with intermediate temperatures. [4]
- K and M stars are orange to deep red and are the coolest stars on the main sequence. [4]
This temperature-based spectral ordering naturally groups stars by luminosity only when they are on the Main Sequence. [9] Outside that band, a star’s spectral type only tells you its surface temperature, not its total power, unless you also know its size. [10]
# Diagrammatic Insight
The H-R diagram, therefore, is not just a chart; it is a map of stellar physics in action. [10] It graphically separates the effects of temperature (the horizontal axis) from the effects of radius (which causes the vertical scatter away from the main sequence). [1] When an astrophysicist measures a star's color (temperature) and its apparent brightness, they can use the diagram, along with the known physics of the Stefan-Boltzmann Law, to estimate its true luminosity by placing it on the chart. [10] If the star lands on the main diagonal, its mass dictates its position; if it falls far above or below, its evolutionary stage—and thus its current size—is the primary driver of its high or low luminosity relative to its heat. [1][9]
In essence, while temperature sets the intensity of light emitted per square meter of surface area (the energy flux), the radius determines the total available area for that emission to occur. [5] The relationship is multiplicative, leading to the dramatic spread in stellar power we observe across the cosmos. [1]
Related Questions
#Citations
Astronomy 1144: Lecture 9 - The Ohio State University
[PDF] Stellar Temperature, Size and Power - Space Math @ NASA
Luminosity and Temperature of Stars - Physics Bootcamp
Is there a relationship between a star's temperature and luminosity ...
[PDF] Classifying stars: HR diagram • Luminosity, radius, and temperature ...
Orion: Week 2: 2.2.2 Mass, luminosity and temperature | OpenLearn
Luminosity - Wikipedia
Pre-lab 9: Stars and the HR Diagram - MTSU Physics
[Solved] What is the main relationship between temperature and star
The H–R Diagram | Astronomy - Lumen Learning