What are the indicators of star formation?
The birth of a star is a cosmic event driven by the relentless pull of gravity acting upon vast, cold clouds of interstellar gas and dust. While the process itself can unfold over millions of years, astronomers have developed several precise methods to measure the rate at which stars are being created in a galaxy, a quantity known as the Star Formation Rate (SFR). [3][7] Determining this rate is essential because it directly links the supply of raw material—gas—to the output—luminous stars—shaping the life cycle of galaxies over cosmic time. [3][9]
# Where stars ignite
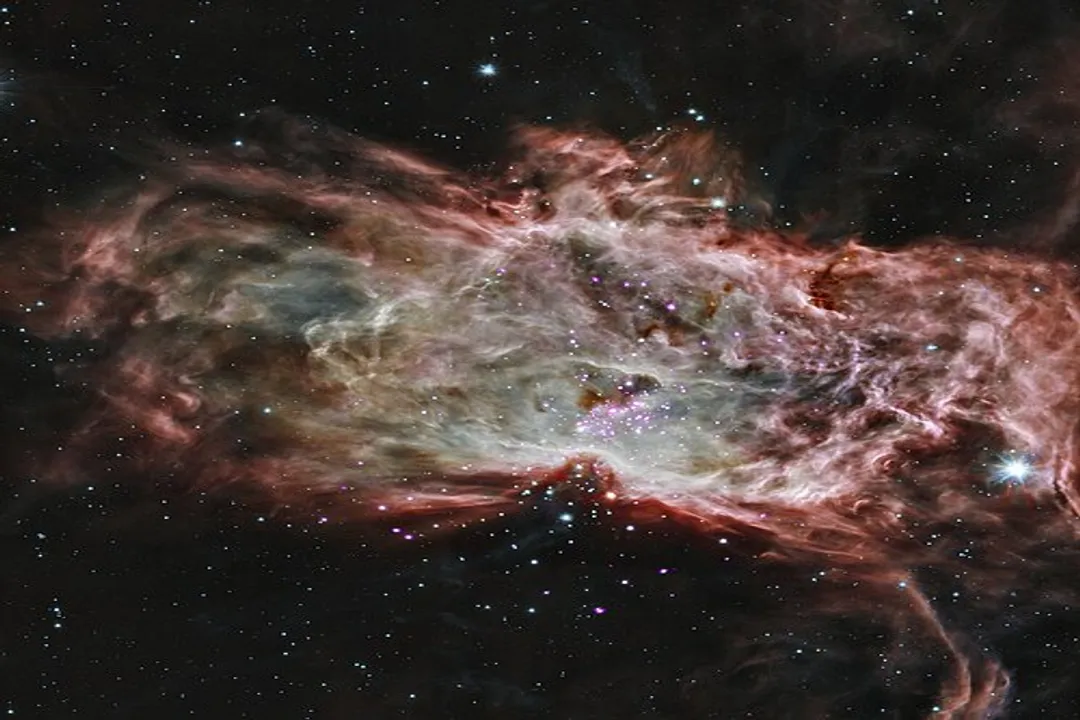
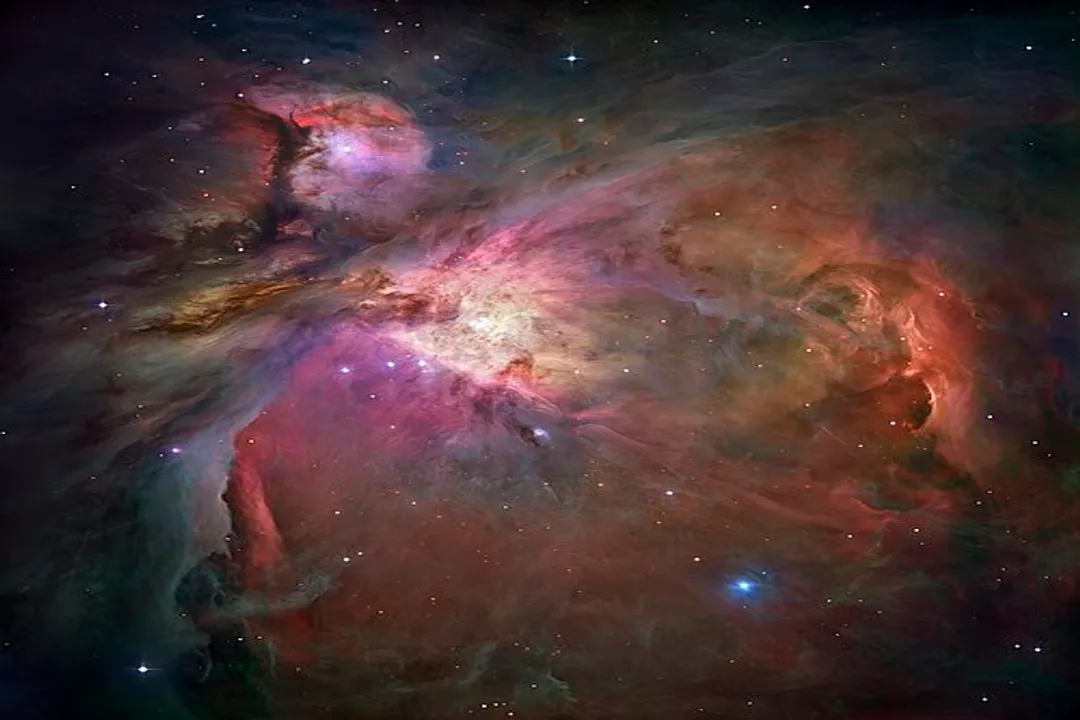
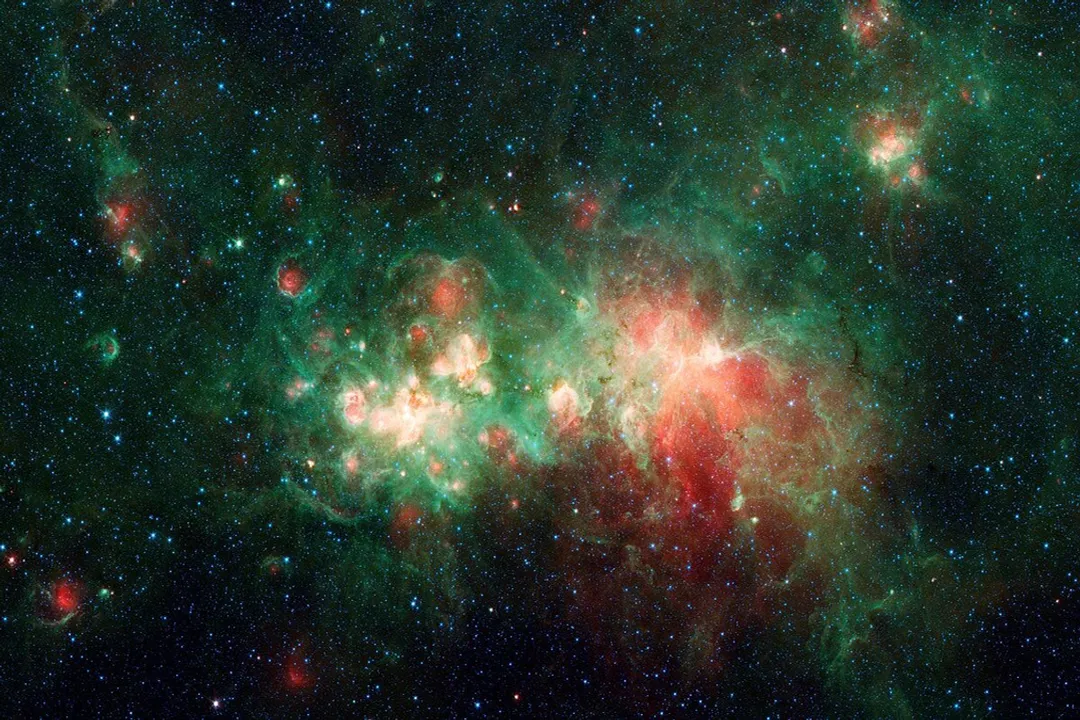
Stars begin their lives within the coldest, densest structures in the interstellar medium, primarily the giant molecular clouds (GMCs). [2][7] These clouds, composed mainly of molecular hydrogen (), must overcome internal pressure and turbulence to collapse under their own gravity. [9] Once a core within a GMC becomes sufficiently dense and opaque, gravitational collapse begins, initiating the stellar nursery phase. [7] Since gas and dust are the primary components, most indicators of current star formation rely on observing either the light emitted by the newly formed, massive stars, or the way that light interacts with the surrounding dust. [1][5]
# Tracing the young
Massive, hot stars are the easiest to spot because they shine incredibly brightly, particularly in the ultraviolet (UV) part of the spectrum. [1][5] These O and B type stars have masses greater than about eight times that of the Sun () and burn through their fuel rapidly. [1] Because their lifespan is relatively short, perhaps only $10^7$ years, the UV emission acts as a snapshot of star formation occurring right now or in the very recent past. [1][8]
The UV luminosity () is a direct proxy for the birth of these massive stars. [5] However, one significant challenge arises: dust mixed within the galaxy effectively absorbs this energetic UV light. [5] This means that observing in the UV alone might severely underestimate the true SFR if a galaxy is dusty, as many newly formed stars are effectively hidden from view. [1]
# Optical emission
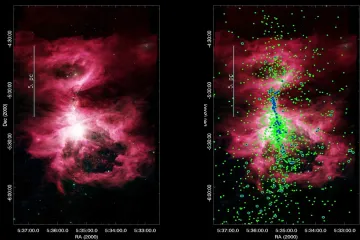
Related to the UV emission is the optical line known as H-alpha (). [1][5] Massive, hot stars also emit copious amounts of high-energy photons that are energetic enough to ionize the surrounding hydrogen gas clouds, stripping electrons from the atoms. [1] When these electrons recombine with the protons, they emit light at a specific wavelength of , which is the characteristic red light of the line. [5] Like UV, emission traces the presence of very young, massive stars and is therefore sensitive to recent star formation activity, probing timescales similar to those sampled by UV light. [1][8] While is still subject to dust extinction, it is generally less affected than the UV, though significant corrections must still be applied depending on the dust content along the line of sight. [5]
# Obscured light
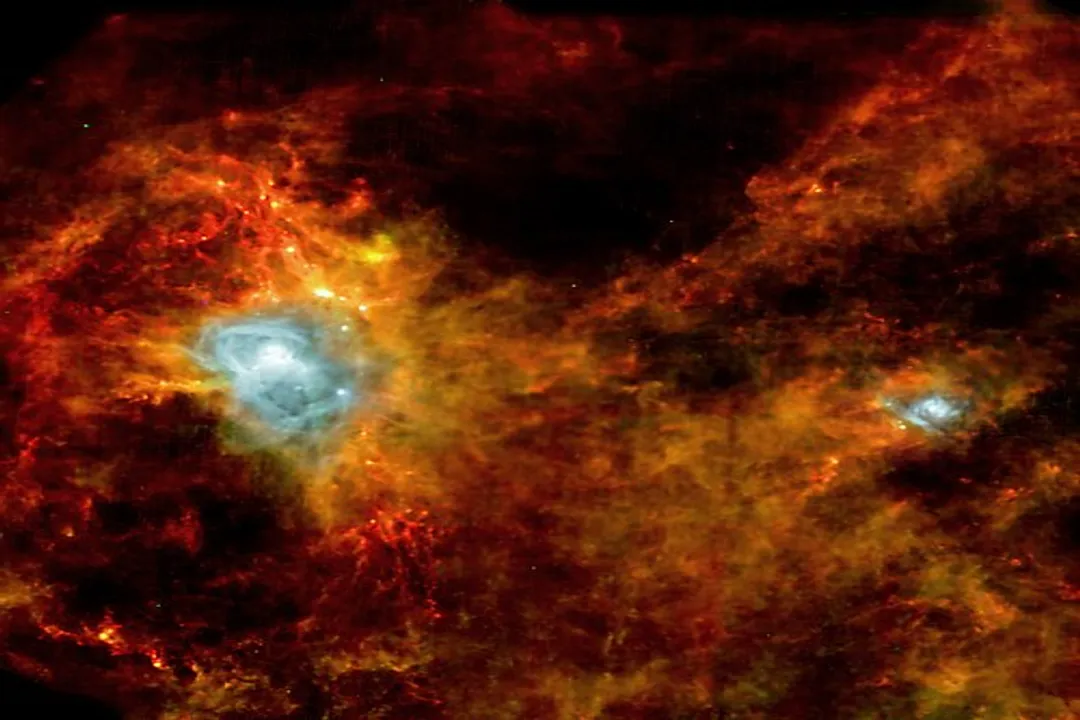
The problem of dust absorption in the UV and leads directly to one of the most reliable ways to estimate the total SFR: looking at the Infrared (IR) emission. [1][5] The energy lost when dust blocks UV light doesn't vanish; it is simply absorbed and then re-radiated at longer wavelengths, primarily in the infrared. [1]
Specifically, the Far-Infrared (FIR), spanning wavelengths from about to , is extremely useful. [1] The FIR luminosity traces the total radiation field powered by all young stars, both visible and heavily obscured, provided the dust has had time to absorb the stellar energy and re-radiate it. [5] Because the dust heats up and cools down over a longer duration than the main-sequence lifetime of the massive stars that power it, FIR traces star formation averaged over a slightly longer timescale, perhaps $10^8$ years, compared to the instantaneous view from UV. [8] A common approach is to measure the luminosity at or as a gauge for the total energy output from dust heating. [1]
If we consider a galaxy where star formation is happening in a steady state, the UV luminosity should ideally match the total IR luminosity (the sum of near-, mid-, and far-IR components), as the energy output must balance. Where , it strongly implies that a significant fraction of the current star formation is deeply embedded in thick dust screens. [5] This concept of energy balance is a useful check; if the calculated SFR based on requires, say, of star formation, but the IR luminosity suggests an input of , you immediately know you are missing $80%$ of the activity due to dust obscuration. [4]
# Raw materials radar
While UV, , and IR trace the output of star formation (the stars themselves or the dust they heat), other indicators look at the input—the gas available for future birth. [3][9] The availability of cold, dense molecular gas is the fundamental prerequisite for star formation to occur at all. [7][9]
# Molecular gas markers
The primary reservoir for star formation is molecular hydrogen (), but it is very difficult to observe directly at the low temperatures found in GMCs. [9] Instead, astronomers often rely on trace amounts of other molecules, most notably Carbon Monoxide (). [9] is a readily observable proxy for because it radiates strongly in the millimeter wave regime, allowing us to map the location and mass of the cold gas supply. [3][9] The conversion factor between the integrated intensity and the total molecular mass is subject to significant uncertainties that depend on the metallicity and physical conditions of the galaxy, which is a known area of variance in SFR estimates derived from gas content versus light emission. [9]
# Atomic gas visibility
Beyond the molecular phase, there is also a substantial amount of Atomic Hydrogen (), which can be observed via its radio emission line. [3][4] While is the precursor to molecular gas, it does not actively form stars until it cools and collapses into dense clouds. [7] Therefore, the reservoir traces the potential for future star formation, but not the current rate itself. [3][4] Observing the line across different galaxies allows astronomers to see how much raw fuel remains before it is locked up in stars. [3]
# Comparing timescales and burstiness
One of the most critical distinctions between these indicators lies in the timescales they sample. [8] A galaxy undergoing a rapid, intense burst of star formation might have very high UV and signals today, but its FIR emission, tracing dust heated by those stars, might lag slightly, and its reservoir will be visibly depleted over time. [8]
Consider a simplified comparison of the timescales probed by different methods:
| Indicator Type | Primary Emission Source | Typical Timescale Probed | Sensitivity to Dust |
|---|---|---|---|
| UV Luminosity () | Young massive stars | years | High Extinction |
| Line | Ionized gas near massive stars | years | Moderate Extinction |
| Far-Infrared (FIR) | Dust re-radiating absorbed UV | years | Low Extinction (Best for obscured) |
| Intensity | Molecular gas ( reservoir) | years (Fuel supply) | N/A (Gas tracer) |
This difference in observational timescales explains why an observer studying a single galaxy at one cosmic epoch might get very different SFR estimates depending on the tracer chosen. [8] For instance, if you measure the content and estimate a very high potential SFR, but your measurement is surprisingly low, it suggests that the galaxy has recently stopped forming stars, even though the fuel is still present. [9] Conversely, if UV is high but FIR is low, it suggests the dust has not yet effectively absorbed and reradiated the energy, perhaps because the burst is extremely recent. [1] Simulating these complex, non-steady-state scenarios is a major challenge in modern astrophysics, requiring the careful weighting of these different spectral views to reconstruct a realistic star formation history. [8]
One way to approach this is by looking at the ratio of two indicators. For example, the ratio of to can reveal the instantaneous extinction at the site of the youngest stars, while the ratio of to reveals the total extinction across the galaxy disk. [5] An interesting nuance arises when considering the stellar initial mass function (IMF)—the distribution of stellar masses formed in a birth event. If the IMF were to change significantly over time (e.g., more low-mass stars being born in the past), then the conversion factor between the observed light (which is dominated by massive stars) and the total mass turned into stars would also change, potentially leading to systematic errors in SFR estimates derived from either UV or . [6]
# Building a reliable measure
To achieve the highest confidence in an SFR measurement for any given galaxy, astronomers generally adopt a combined approach, synthesizing information from multiple wavelengths. [4] It is rarely sufficient to rely on a single indicator. A complete picture requires accounting for the immediate, short-lived products (UV/), the energy reradiated by the bulk of the dust (FIR), and the remaining fuel supply (). [1][4]
Imagine trying to gauge the productivity of a factory. Looking only at the exhaust fumes () tells you what is happening right now, but ignores the product hidden in opaque shipping containers (). If you then check the raw material inventory (), you see how much more work could be done. The true output is only fully appreciated when you account for the obscured shipments and the current energy consumption. [1][5] This multi-wavelength strategy moves the measurement from a simple count of bright objects to a calculated rate of mass conversion, which is the ultimate goal in understanding galactic evolution. [3] By carefully calibrating the relationships between these disparate physical tracers—a process often done by studying nearby, well-resolved star-forming regions—astronomers build the necessary relationships to apply across vast cosmic distances where only integrated light can be captured. [1][4]
Related Questions
#Citations
Star Formation Rate Indicators - Daniela Calzetti
Star Basics - NASA Science
Star Formation in Galaxies - UA Astronomy
Star formation Indicators
Indicators of star formation: 4000 Å break and Balmer lines. - ADS
Star formation - Wikipedia
The time-scales probed by star formation rate indicators for realistic ...
[PDF] STAR FORMATION & STAR FORMATION HISTORY