What information does the light from a star tell us?

The light that travels across unimaginable cosmic distances to reach our eyes is far more than just a faint twinkle; it is a rich carrier of fundamental physical data about its source, a distant star. By analyzing this arriving radiation—a process that hinges on splitting the light into its component parts—astronomers can decode the star’s chemical makeup, its surface heat, how fast it is moving through space, and even clues about its immediate environment and potential companions. This powerful technique is known as astronomical spectroscopy, and it transforms a simple point of light into a detailed physical profile.
The foundational concept rests on the simple idea that every star emits light across a continuous range of energies, which, when separated, forms a spectrum—much like a rainbow. When sunlight, for example, passes through raindrops, the light separates into its constituent colors, revealing the spectrum within the white light. However, when astronomers aim instruments at stars, they rarely see a perfectly smooth rainbow. Instead, they find gaps—dark lines interrupting the continuous wash of color.
# Historical Clues
The systematic study of these stellar features began with Isaac Newton demonstrating that prisms only reveal the colors already present in white light. Centuries later, in the early 1800s, Joseph von Fraunhofer, using high-quality prisms, meticulously cataloged hundreds of these dark gaps in the solar spectrum, now famously known as Fraunhofer lines. Fraunhofer could observe them but could not explain why they existed. The answer arrived decades later through the work of Robert Bunsen and Gustav Kirchhoff. They established that different chemical elements, when heated, emit light at specific, unique colors (emission lines). Crucially, they realized that if light passes through a cooler gas containing those same elements, the gas absorbs energy at precisely those same wavelengths, creating the dark absorption lines seen in the stellar spectrum. This fundamental link—that a specific dark line corresponds to a specific element absorbing energy—is the cornerstone of stellar analysis.
# Chemical Fingerprints
The most direct information gleaned from stellar light is the star’s chemical composition. Since the pattern of absorption lines acts as a unique signature, or celestial fingerprint, for every element on the periodic table, astronomers can compare the lines observed in a star’s spectrum against known elemental patterns. By matching the positions of the dark lines, they can identify the specific atoms and ions present in the star's outer atmosphere. Even elements that are rare on Earth, like Helium, were first identified this way; the Sun’s spectrum revealed lines that did not match any known terrestrial element, leading to its prediction decades before it was isolated in a lab.
Furthermore, the relative strength and width of these lines tell a story about abundance and the star’s stage of life. Analyzing the equivalent width of these lines helps determine the relative abundances of the elements present. This classification is essential, allowing astronomers to categorize stars into populations based on their metal content—for instance, Population I stars, like our Sun, are younger and metal-rich, while the ancient Population III stars are nearly devoid of elements heavier than hydrogen and helium. If a spectrum shows the emission lines of Helium alongside the absorption lines of Hydrogen, it can suggest the star has evolved past its main-sequence hydrogen-burning phase and begun fusing Helium, a characteristic often seen in red giants.
The sheer scope of this identification is immense. For the Sun alone, astronomers have cataloged over 20,000 absorption lines between 293.5 and 877.0 nanometers, though only about three-quarters of these have been definitively linked to an element. This process extends beyond single stars; by analyzing the combined light from a galaxy, scientists can gauge the overall composition of billions of stars within it.

# Decoding Temperature
The light’s color and the precise wavelengths of its spectral lines are intrinsically linked to the star's surface temperature. The continuous spectrum—the underlying rainbow—peaks at a specific wavelength, which is directly related to temperature via Wien’s Displacement Law: , where is the peak wavelength and is Wien’s constant. Simply put, hotter objects emit shorter peak wavelengths, appearing bluer, while cooler objects peak at longer wavelengths, appearing redder.
The absorption lines themselves also act as sensitive thermometers. The presence and strength of specific elemental lines vary dramatically with temperature, providing a secondary, and sometimes more precise, temperature measurement. For example, very hot stars exhibit strong Hydrogen lines, whereas cooler stars display prominent lines from elements like Calcium and Sodium. This temperature dependence is so reliable that it forms the basis of the spectral classification system astronomers use to organize stars:
| Spectral Class | Color | Surface Temperature (K) | Key Elements Evident |
|---|---|---|---|
| O | blue | over 30,000 | ionized He, weak H |
| B | blue-white | 30,000 – 15,000 | neutral He, weak H |
| A | white | 15,000 – 10,000 | strong H |
| F | white-yellow | 10,000 – 7,000 | weak H, metals (Ca, Fe) |
| G | yellow | 7000 - 5000 | strong metals, esp. Ca |
| K | orange | 5000 - 4000 | strong metals; CH and CN |
| M | red | 4000 - 3000 | strong molecules (incl. TiO) |
Observing the peak of the continuum, coupled with the spectral class, offers an immediate, powerful categorization. A newly observed star's spectrum immediately places it on this temperature/composition sequence, which, when combined with luminosity measurements, also informs calculations about its physical size using the Stefan-Boltzmann relation: .
# Measuring Motion
Perhaps one of the most astounding pieces of information derived from stellar light is motion, both toward/away from us (radial velocity) and rotation across our line of sight. This is achieved by observing the Doppler effect.
If a star is moving toward the observer, the wavelength of all its spectral lines will be uniformly compressed, shifting them toward the higher-frequency, shorter-wavelength, or blue end of the spectrum—a blueshift. Conversely, if the star is receding, the wavelengths stretch out, resulting in a redshift. The magnitude of this shift allows astronomers to calculate the precise radial velocity, , using the formula relating the shift to the speed of light, : , where is the calculated redshift value. This principle is used universally, from measuring the recession of distant galaxies (Hubble’s Law) to detecting nearby exoplanets orbiting their parent stars.
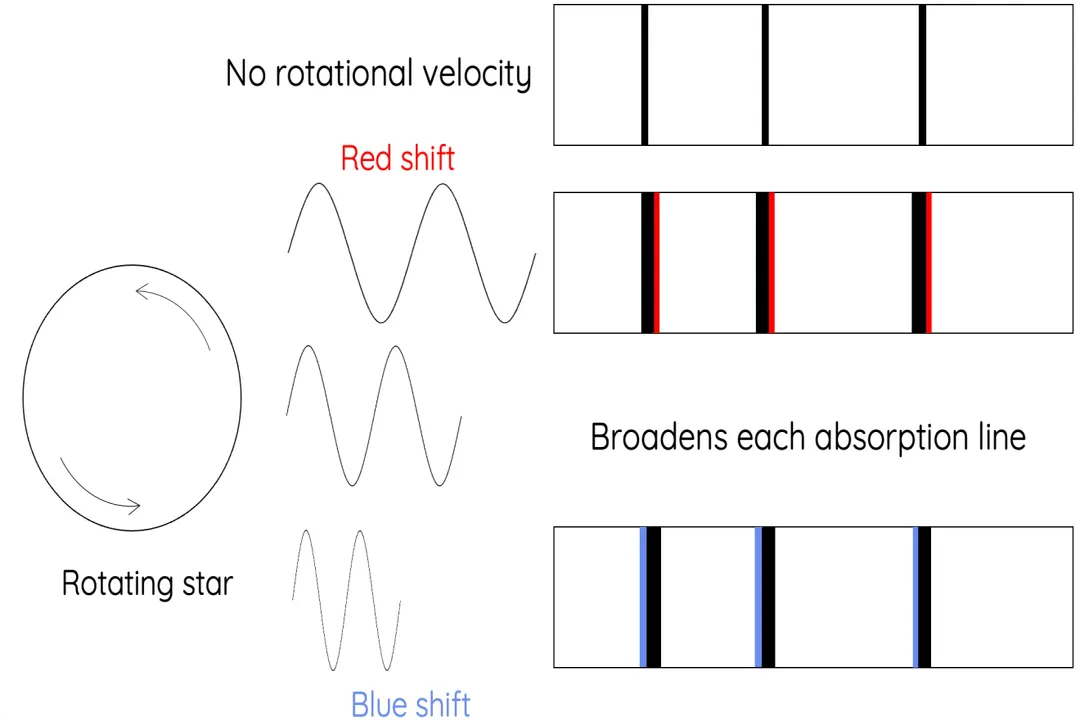
Rotation adds a layer of complexity but is also readable in the spectrum. The side of a star spinning toward us has its light blueshifted, while the side spinning away has its light redshifted. The resulting overall spectrum exhibits broadened absorption lines, as the light from the entire stellar surface is blended together, with the line broadening directly related to the speed of rotation.

# Stellar Density and Environment
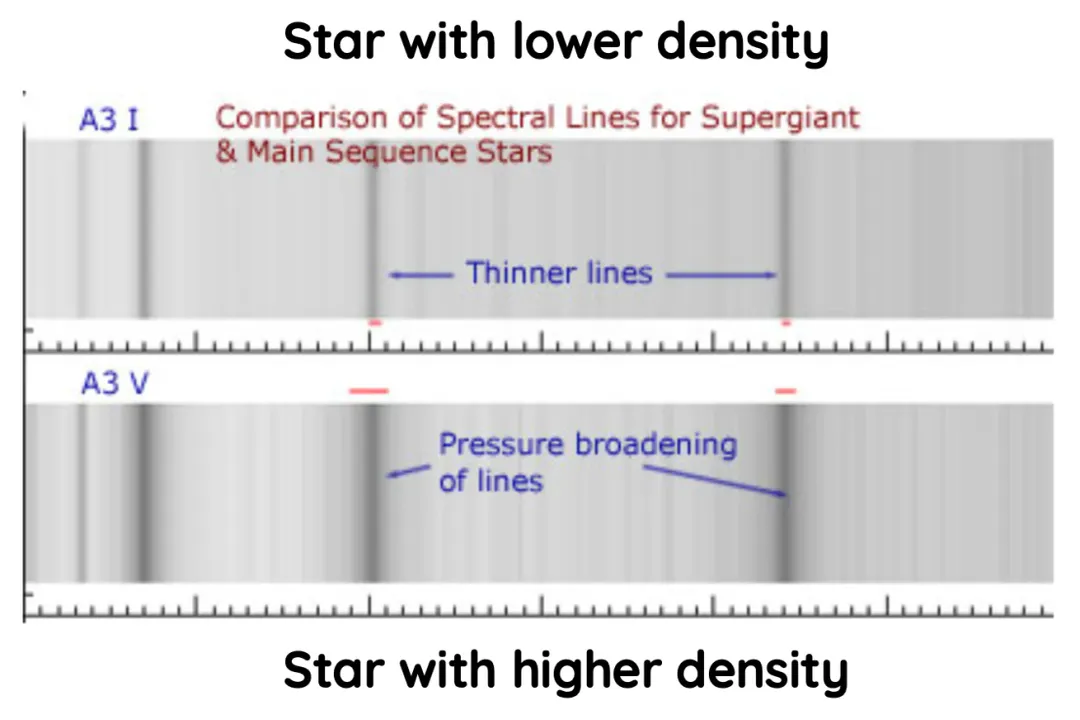
The spectral lines also contain subtle clues about the physical conditions within the star's atmosphere, particularly its density. In a high-density environment, gas pressure is greater, leading to more frequent and powerful collisions between atoms. These collisions subtly influence the energy levels of the orbiting electrons, causing the sharp absorption lines to broaden. Therefore, the degree of broadening, when rotational effects are accounted for, indicates the pressure, and thus the density, of the stellar material near the surface. For instance, a star that appears to have the same surface temperature as another might exhibit broader spectral lines, signaling it is far denser, perhaps packing far more mass into a similar volume.
Furthermore, the light we analyze isn't always pristine starlight. The light passing through the space between the star and Earth, known as the interstellar medium (ISM), is also affected. Dust and gas clouds in the ISM absorb certain wavelengths, creating their own distinctive absorption features superimposed on the stellar spectrum. Analyzing these intervening lines allows astronomers to characterize the chemical composition, density, and velocity of the clouds of gas and dust scattered throughout our galaxy. In regions near young stars, spectral features can even reveal the presence of complex organic molecules or dust disks that are the very birthplaces of planets.
# Evolving Tools for Deeper Views
The quest to gather this data has driven monumental technological advancements. Early analysis relied on prisms, but for detailed work, modern instruments employ reflection gratings, which can separate wavelengths with much higher resolution. When looking at the farthest reaches of the Universe, the information becomes stretched by cosmic expansion. Light originally emitted in the ultraviolet by the earliest galaxies is redshifted so severely that it arrives in the near-infrared part of the spectrum. To see this ancient light, instruments like the Near-Infrared Spectrograph (NIRSpec) on the James Webb Space Telescope must operate in space, above the Earth’s atmosphere, which naturally blocks much of the ultraviolet and infrared light. These modern spectrographs are also revolutionizing efficiency. Instead of observing one star at a time through a single slit, instruments like NIRSpec can deploy micro-shutters to capture the spectra of around a hundred stars or faint galaxies simultaneously in a single exposure, statistically advancing fields like star and planet formation studies.
The capacity to analyze light across the entire electromagnetic spectrum—from radio waves (which reveal the 21 cm neutral hydrogen line, crucial for mapping spiral arms in the Milky Way) to high-energy X-rays—demonstrates that starlight is essentially a universal Rosetta Stone. By meticulously charting the darkness, brightness, and displacement of every feature in that faint light, we transition from merely seeing a distant fire to understanding its internal furnace, its chemical recipe, and its precise movement through the cosmic void.
#Videos
What do spectra tell us about stars? - YouTube
Related Questions
#Citations
Spectra and What They Can Tell Us - Imagine the Universe! - NASA
Astronomical spectroscopy - Wikipedia
What do spectra tell us about stars? - YouTube
What is stellar spectroscopy and what does it tell us about stars?
Stellar Spectrum | Starlight - Space FM
Module 7 The Nature of Light: Spectra of Stars – HSC Physics
Spectroscopy & Stars - Earthguide