Where are the hottest stars plotted on the H-R diagram's horizontal axis?
On the left side
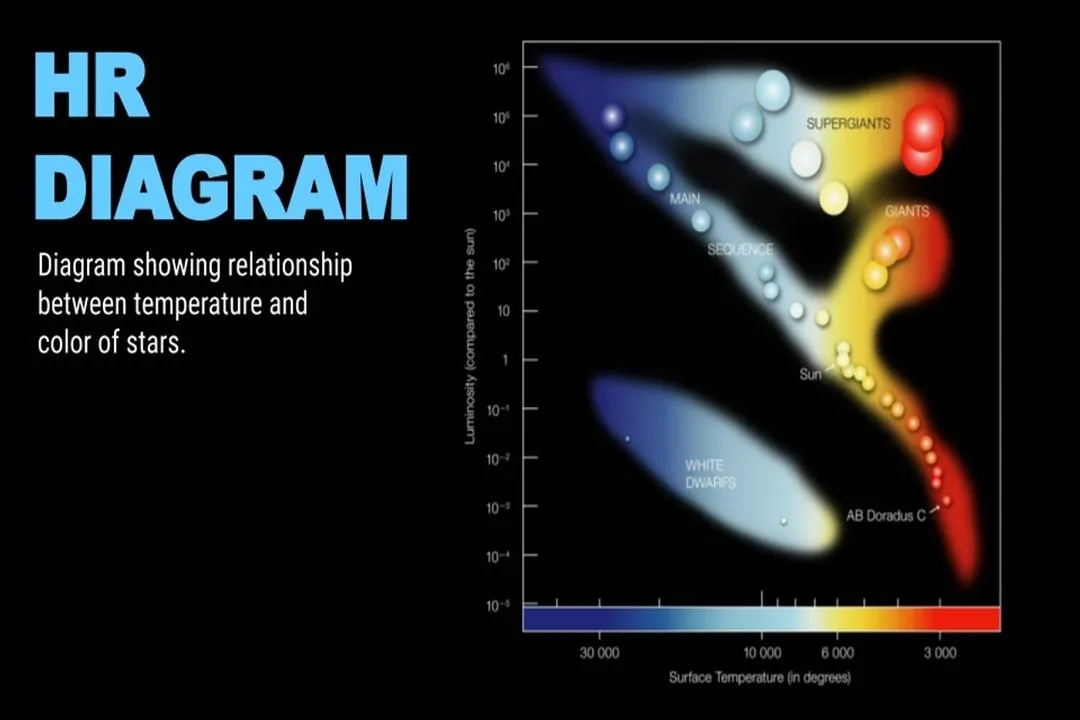
The horizontal axis of the Hertzsprung-Russell diagram represents the surface temperature of the star, which is intrinsically linked to its spectral class and color. In this unique graphical arrangement, the hottest stars are intentionally mapped to the extreme left of the chart. These stars, often possessing blue-white colors, exhibit temperatures that can surpass 30,000 Kelvin. Conversely, the coolest stars, which appear red, are positioned towards the right side of this axis, typically hovering around 3,000 Kelvin. This inverse relationship between temperature value and left-to-right position is a crucial, albeit initially counterintuitive, aspect of reading the H-R diagram.
#Videos
HR Diagram Explained - Star Color, Temperature and Luminosity